
Key Takeaways
- Scientists have found microplastics in human blood, lungs, placentas, breast milk, testes, artery plaque and brain tissue, and brain levels rose about 50% between 2016 and 2024.
- These microplastics statistics show people take in tens of thousands of particles a year from food and drink alone, and bottled water carries about 240,000 plastic particles per liter.
- The world made 430.9 million tonnes of plastic in 2024, and only about 9% of plastic waste is recycled.
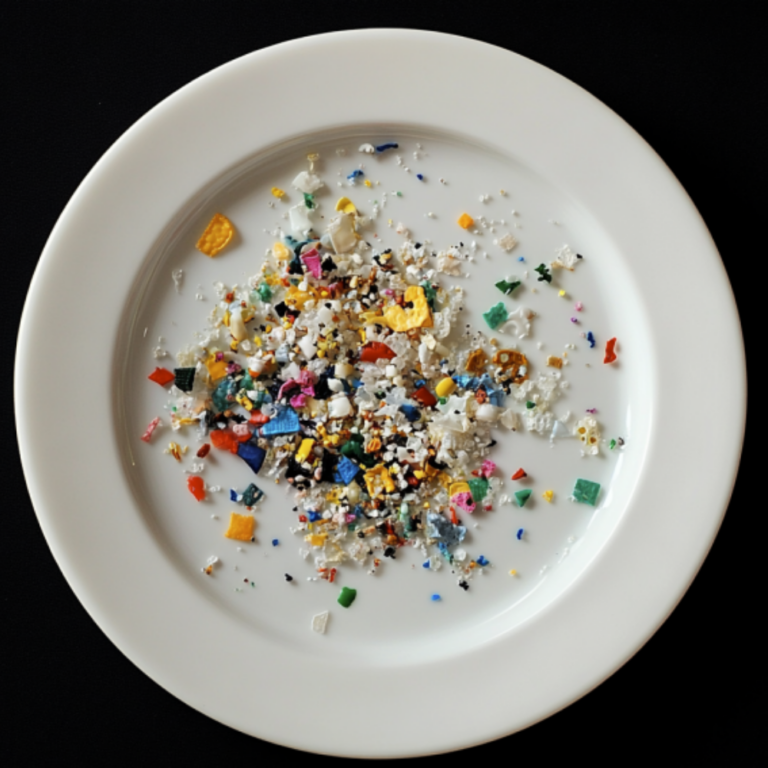
Microplastics statistics used to read like distant ocean news, but the latest studies bring the story much closer to home. Researchers have now found tiny plastic particles in human blood, lungs, placentas, breast milk and brain tissue, and the amount in our brains appears to be climbing. In 2024 alone, the world produced 430.9 million tonnes of plastic, according to Plastics Europe, and every piece of it will eventually break down into smaller ones.
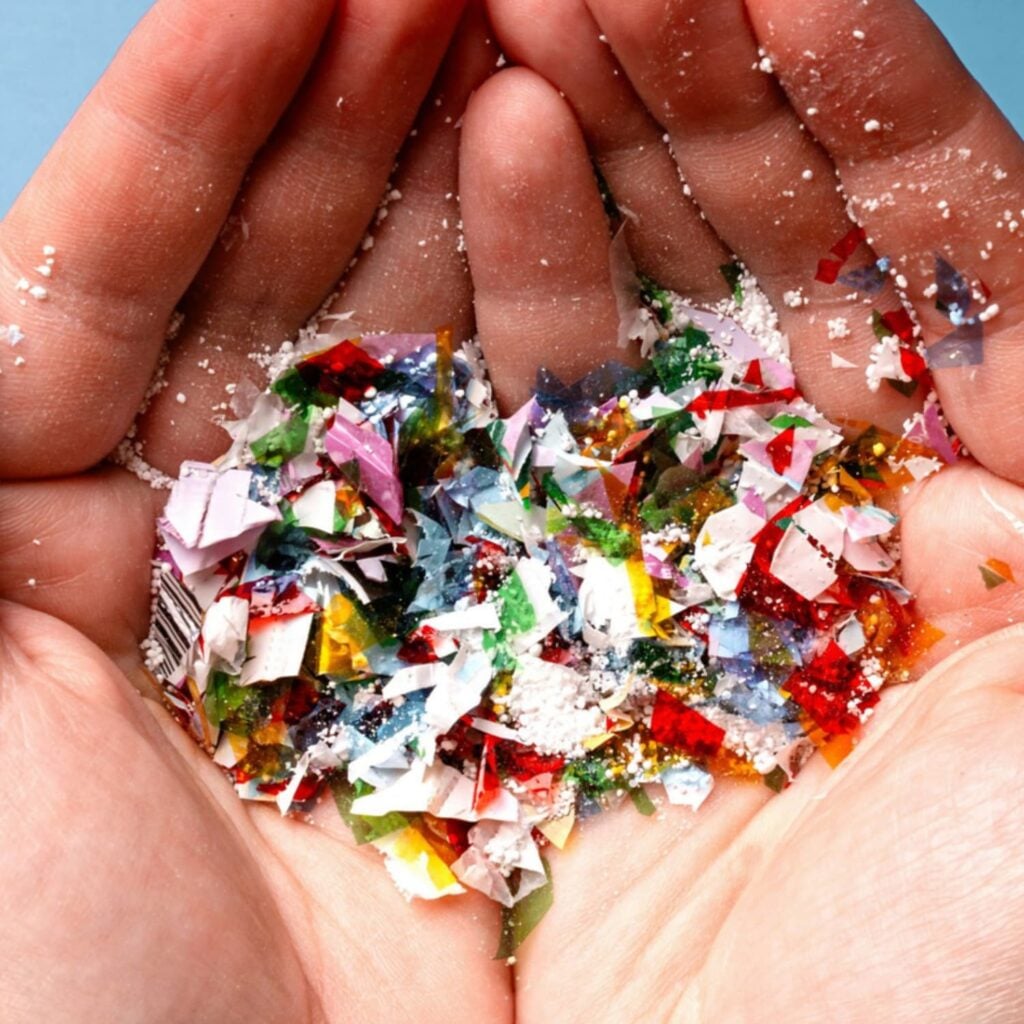
A microplastic is any piece of plastic smaller than 5 millimeters, as defined by NOAA. This page gathers the most important numbers about them in one place, each one traced back to the original study or report rather than to another blog. We review it every quarter as new research comes out, so you can come back to it and cite it with confidence.
Jump to: In the Body | Food and Drinks | Laundry | How Much We Take In | Ocean | Production and Recycling
Where Have Microplastics Been Found in the Human Body?
Microplastics have been found in human blood, lungs, placentas, breast milk, testes, artery plaque and brain tissue, and brain levels rose about 50% between 2016 and 2024.
A few years ago, plastic inside the human body sounded like science fiction. Then researchers started looking, and almost everywhere they looked, they found it. The first discovery came in 2021, when an Italian team found tiny plastic fragments in placentas from healthy pregnancies, and the list has grown quickly since then.
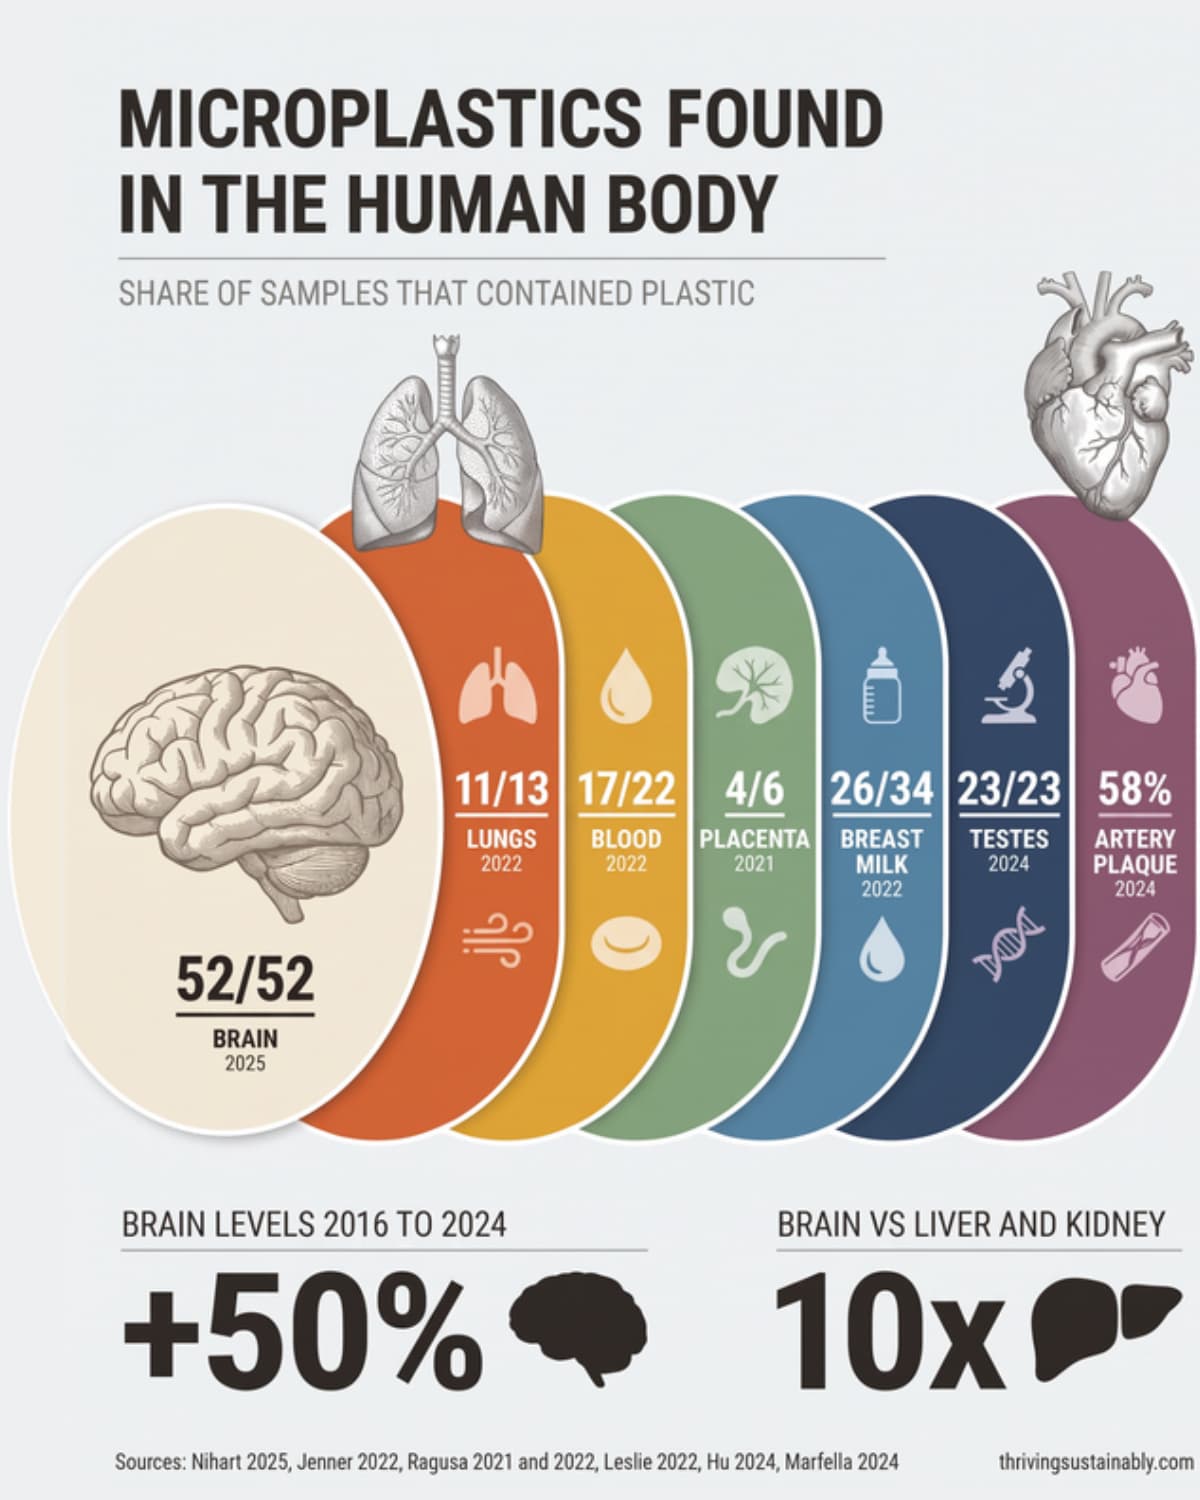
- Placenta: 12 microplastic fragments were found in 4 of 6 placentas, on the mother’s side, the baby’s side and the membranes (Ragusa et al., 2021).
- Blood: 17 of 22 healthy adult volunteers (77%) had plastic particles in their blood (Leslie et al., 2022).
- Lungs: 39 microplastics turned up in 11 of 13 lung tissue samples from living surgery patients, with the most in the lower lung (Jenner et al., 2022).
- Breast milk: 26 of 34 new mothers had microplastics in their breast milk one week after giving birth (Ragusa et al., 2022).
- Testes: microplastics were found in all 23 human testes tested, along with all 47 dog testes in the same study (Hu et al., 2024).
- Heart arteries: 150 of 257 patients (58.4%) had polyethylene in their artery plaque, and they were 4.5 times more likely to have a heart attack, stroke or die over about 34 months than patients without it (Marfella et al., 2024).
- Brain: all 52 brain samples contained micro and nanoplastics. The median level rose from 3,345 to 4,917 micrograms per gram between 2016 and 2024, about a 50% increase, and 2024 brain levels were about 10 times higher than liver and kidney (Nihart et al., 2025).
Each of these studies is small, and finding plastic is not the same as proving harm. The heart and brain studies show a link, not proof that plastic caused the outcome. The brain study also found higher levels in 12 people with dementia, but the researchers say dementia itself may let more plastic in.
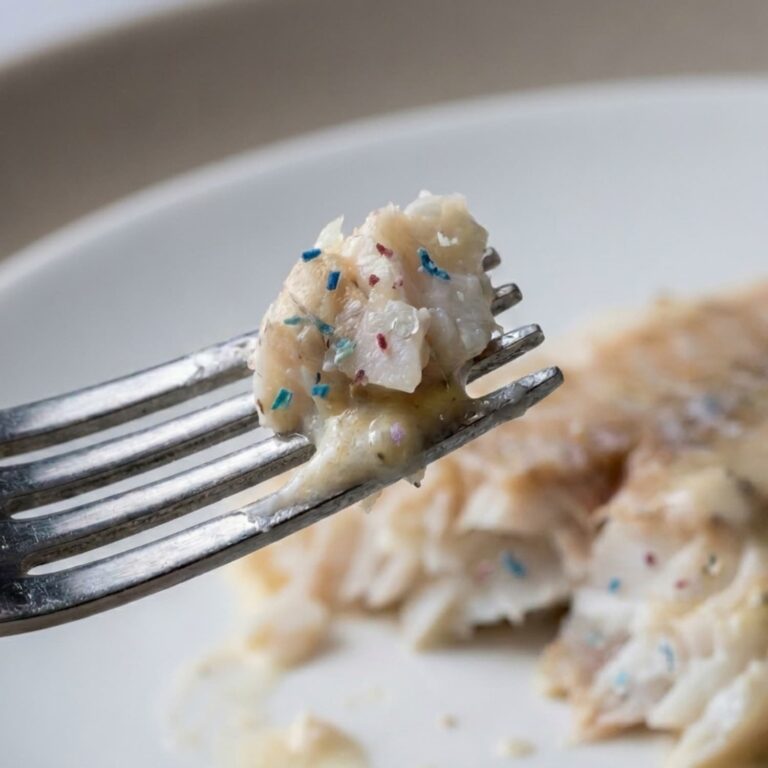
Don’t Miss: The Microplastics HubEvery guide we have on microplastics in one place, from where they come from to the simple swaps that cut them at home. Read more →Seen together, these findings show how far plastic has traveled into our lives in a very short time. Food and drinks are one of the main ways it gets there, and that is where the numbers get personal.
How Much Microplastic Is in Our Food and Drinks?
A liter of bottled water holds about 240,000 plastic particles on average, and a single plastic tea bag can release 11.6 billion microplastics into one cup.
Some of the biggest numbers on this page come from everyday kitchen habits. That is also the hopeful part, because kitchen habits are some of the easiest ones to change.
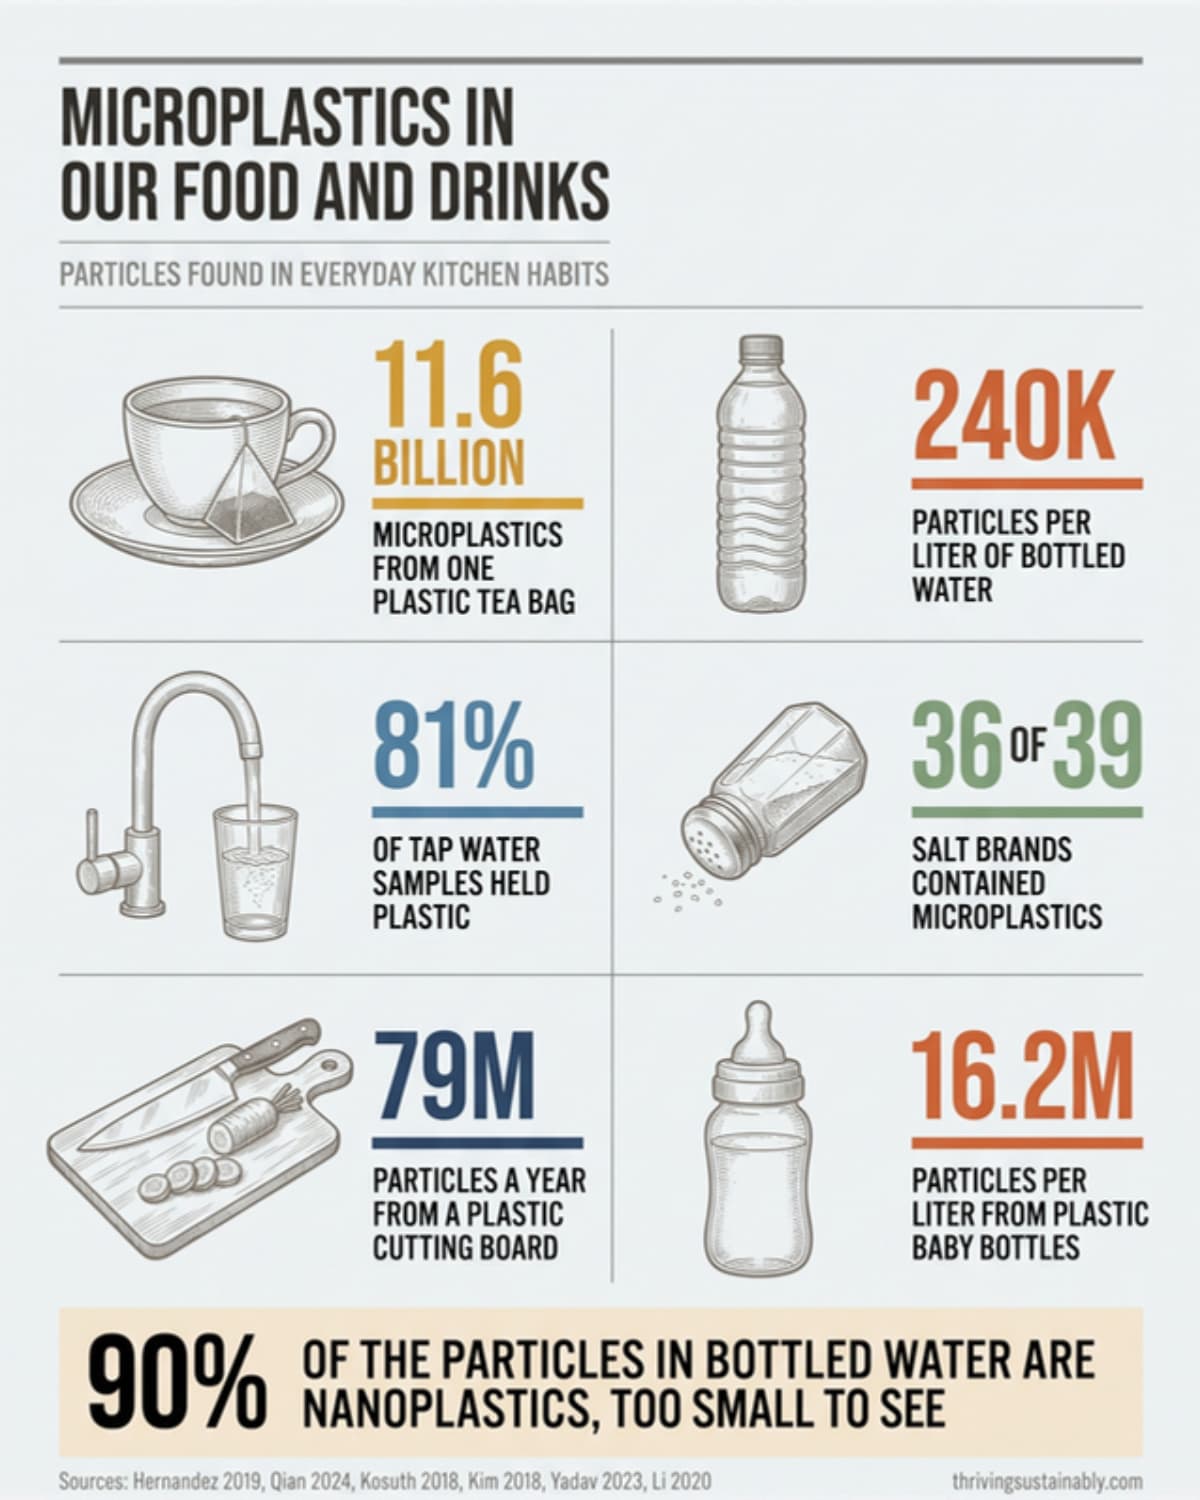
- Bottled water: about 240,000 plastic particles per liter, 10 to 100 times more than earlier estimates, and about 90% of them are nanoplastics (Qian et al., 2024).
- Tap water: 81% of 159 tap water samples from around the world contained plastic particles, mostly fibers (Kosuth et al., 2018).
- Tea bags: steeping one plastic tea bag at 95°C releases about 11.6 billion microplastics and 3.1 billion nanoplastics into a single cup (Hernandez et al., 2019).
- Salt: microplastics were found in 36 of 39 salt brands from 21 countries (Kim et al., 2018).
- Cutting boards: chopping on plastic boards may add 14 to 17 million polyethylene microplastics, or about 79 million polypropylene microplastics, to food each year (Yadav et al., 2023).
- Baby bottles: polypropylene baby bottles released up to 16.2 million microplastic particles per liter during formula prep, and hotter water raised the count sharply (Li et al., 2020).
Each of these sources has a simple swap. Loose-leaf tea skips the plastic tea bag, a wood board replaces a plastic one (see our guide to non-toxic cutting boards), and glass baby bottles take heat out of the plastic equation during formula prep. For more ways to cut plastic from meals, read our guide to microplastics in food.
How Does Laundry Add Microplastics to the Environment?
Washing synthetic clothes is the largest source of primary microplastics in the ocean, responsible for about 35% of them, and one wash can shed 640,000 to 1.5 million fibers per kilogram of fabric.
Every time synthetic clothes go through the wash, tiny fibers break loose and flow down the drain. Many are small enough to slip through wastewater treatment and travel all the way to rivers and the sea.
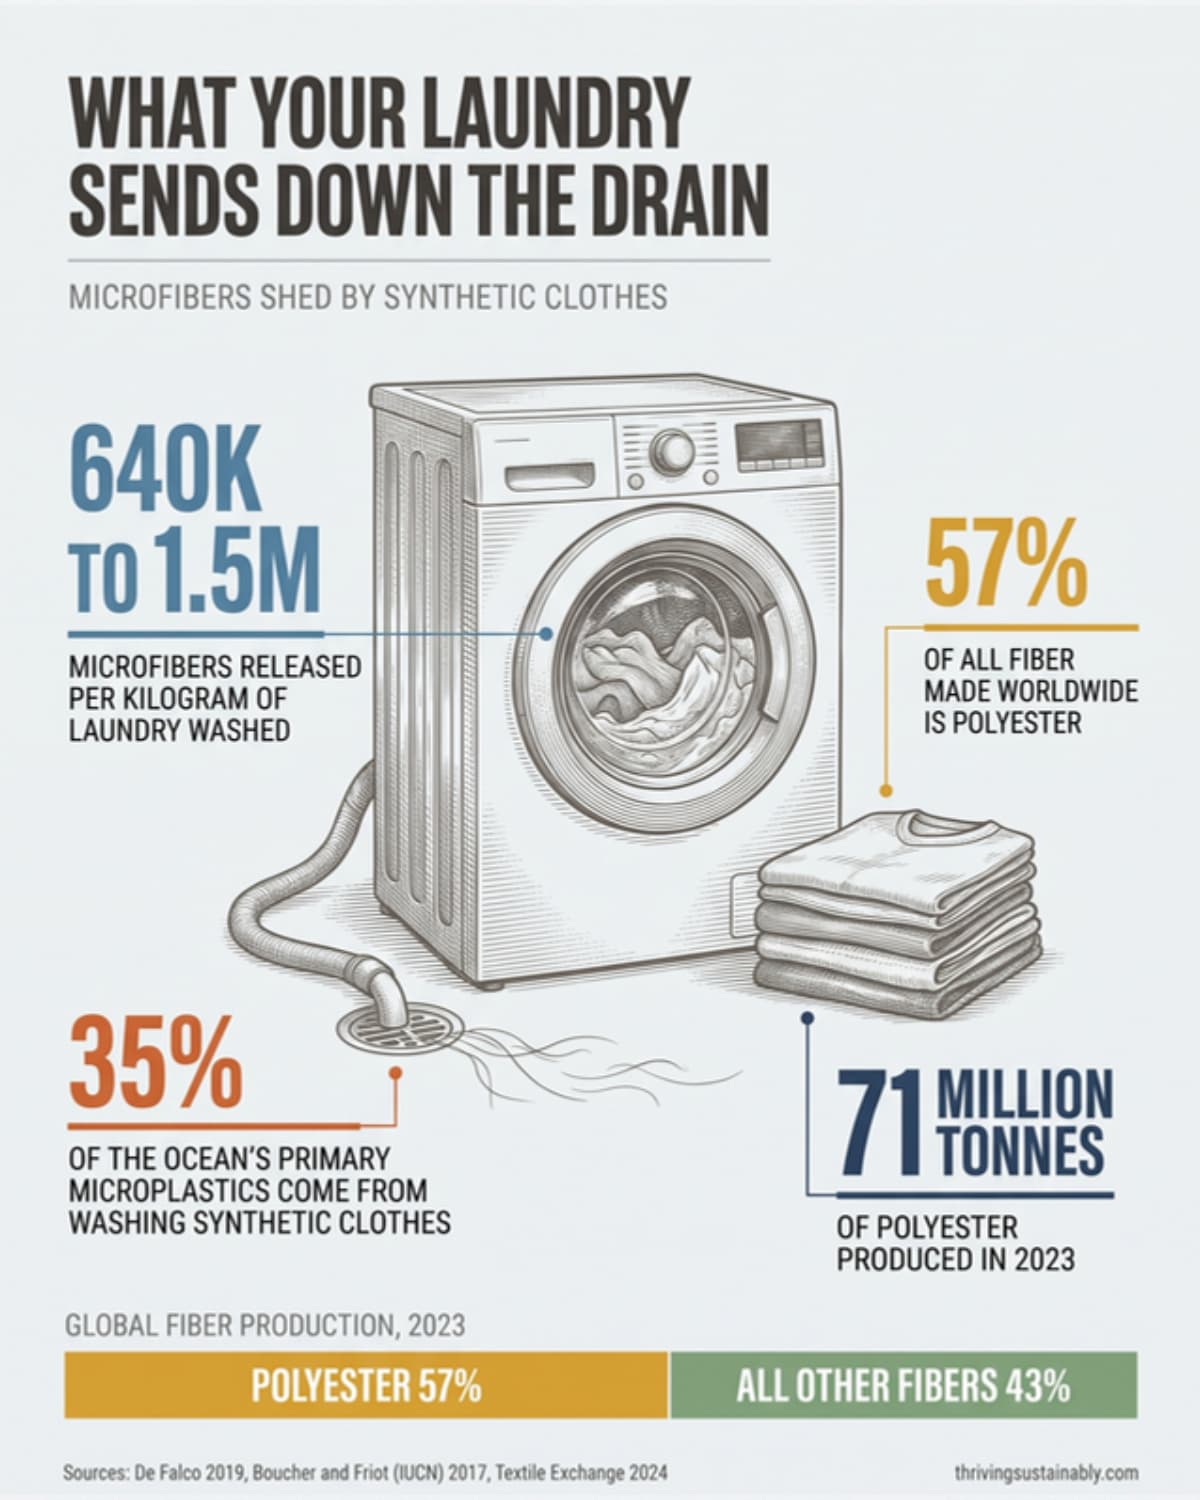
- Per wash: washing synthetic clothes releases 640,000 to 1,500,000 microfibers per kilogram of fabric (De Falco et al., 2019).
- Ocean share: synthetic textiles are the single biggest source of primary microplastics in the ocean, at about 35%, according to the International Union for Conservation of Nature (IUCN) (Boucher and Friot, 2017).
- Polyester everywhere: polyester made up 57% of all fiber produced worldwide in 2023, about 71 million tonnes (Textile Exchange, 2024).
Washing full loads in cold water on a shorter cycle helps clothes shed less, and buying fewer synthetic pieces helps even more over time. Our guide to eco-friendly laundry walks through the habits that make the biggest difference, and you can learn why recycled polyester still sheds fibers.
How Many Microplastics Do People Take In Each Year?
People in the U.S. may take in 39,000 to 52,000 microplastic particles a year from food and drink, and 74,000 to 121,000 once the particles they breathe in are counted.
Most of us never see the plastic we swallow or breathe, which is what makes these numbers so hard to picture. Researchers built them by adding up what has been measured in common foods, drinks and air, then matching it to how much the average person eats and breathes.
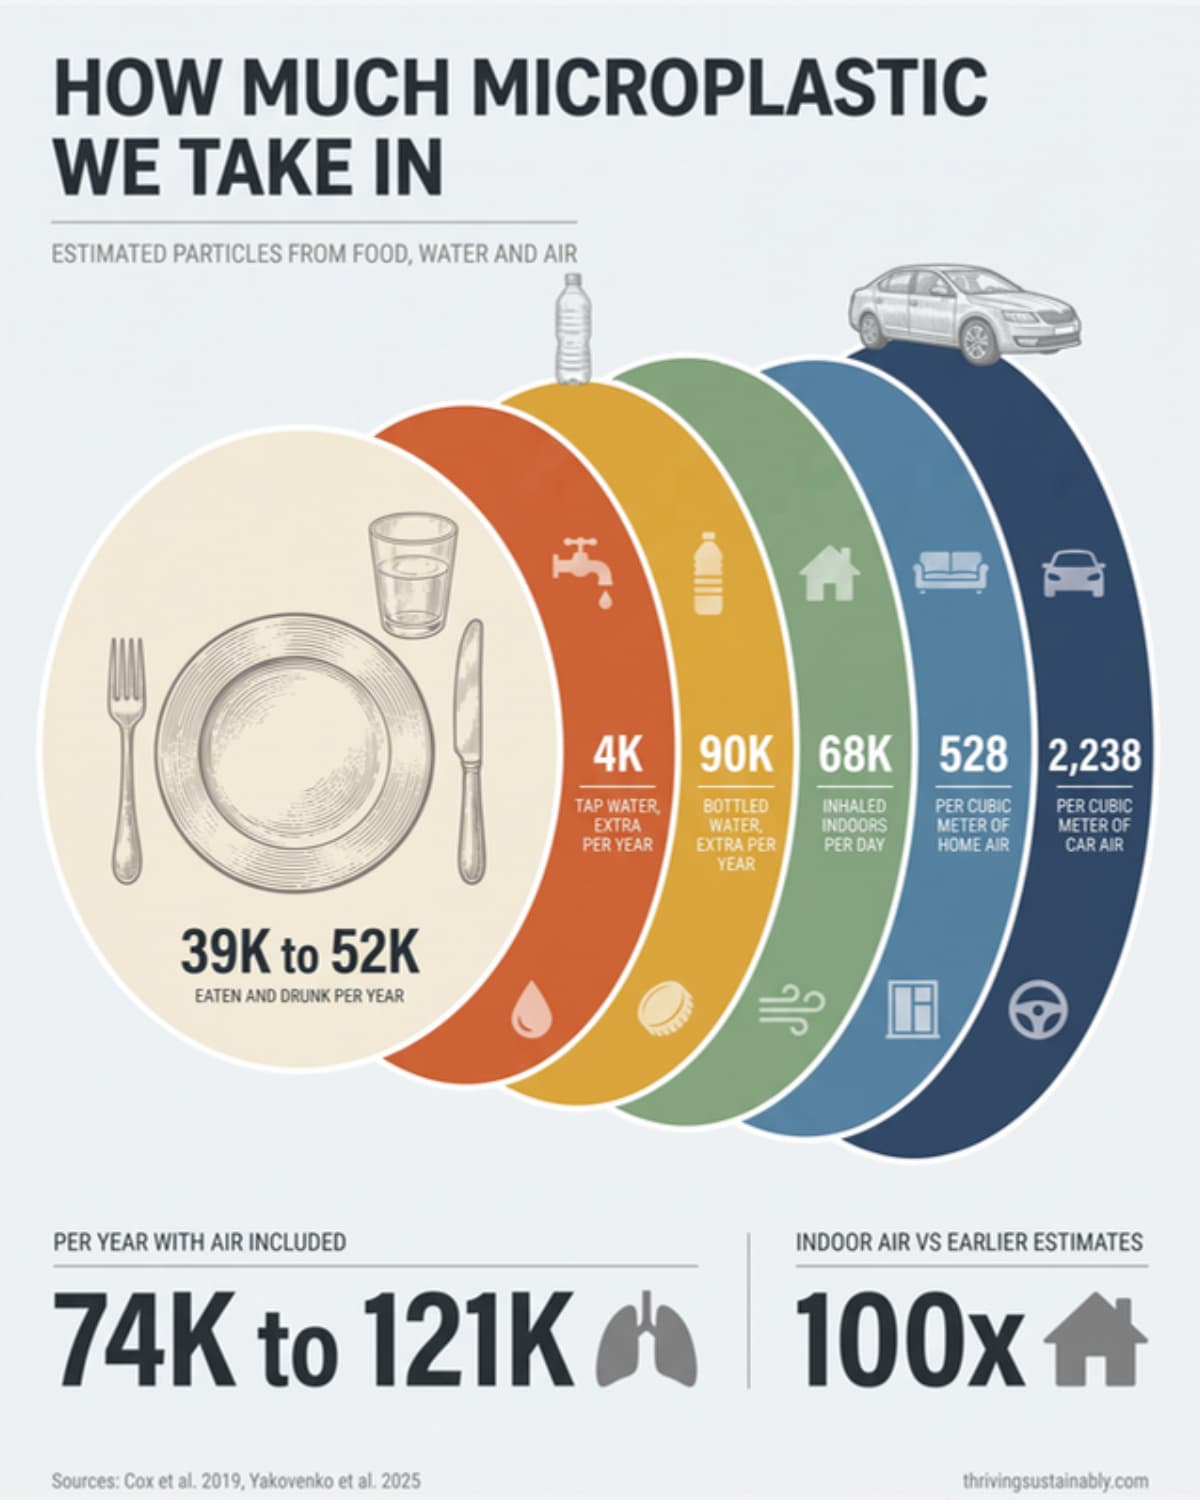
- Food and drink: an estimated 39,000 to 52,000 microplastic particles a year, depending on age and sex (Cox et al., 2019).
- Food, drink and air combined: about 74,000 to 121,000 particles a year (Cox et al., 2019).
- Water choice: people who get their daily water only from bottled water may take in an extra 90,000 particles a year, compared with about 4,000 from tap water (Cox et al., 2019).
- Indoor air: adults may breathe in about 68,000 tiny microplastic particles (1 to 10 micrometers) a day from indoor air, about 100 times more than earlier estimates (Yakovenko et al., 2025).
- Cars vs homes: air inside cars held a median of 2,238 particles per cubic meter, compared with 528 in apartments (Yakovenko et al., 2025).
✨ TIP
Fill Up From the Tap
The single biggest difference in these intake numbers comes from the water you drink. Filling a glass or stainless steel water bottle from the tap instead of buying bottled water can cut tens of thousands of particles from your year.
Air turned out to be a bigger source than many people expected, especially inside cars, where heat and worn interior plastics shed tiny particles. Opening a window and running a HEPA air purifier at home are two easy ways to bring that number down.
How Much Plastic Is in the Ocean?
An estimated 171 trillion plastic particles, mostly microplastics, were floating on the ocean’s surface in 2019, weighing about 2.3 million tonnes.
The ocean is where much of our plastic story ends up, and the numbers have climbed fast since the mid 2000s. Microplastics have even turned up in snow near the top of Mount Everest.
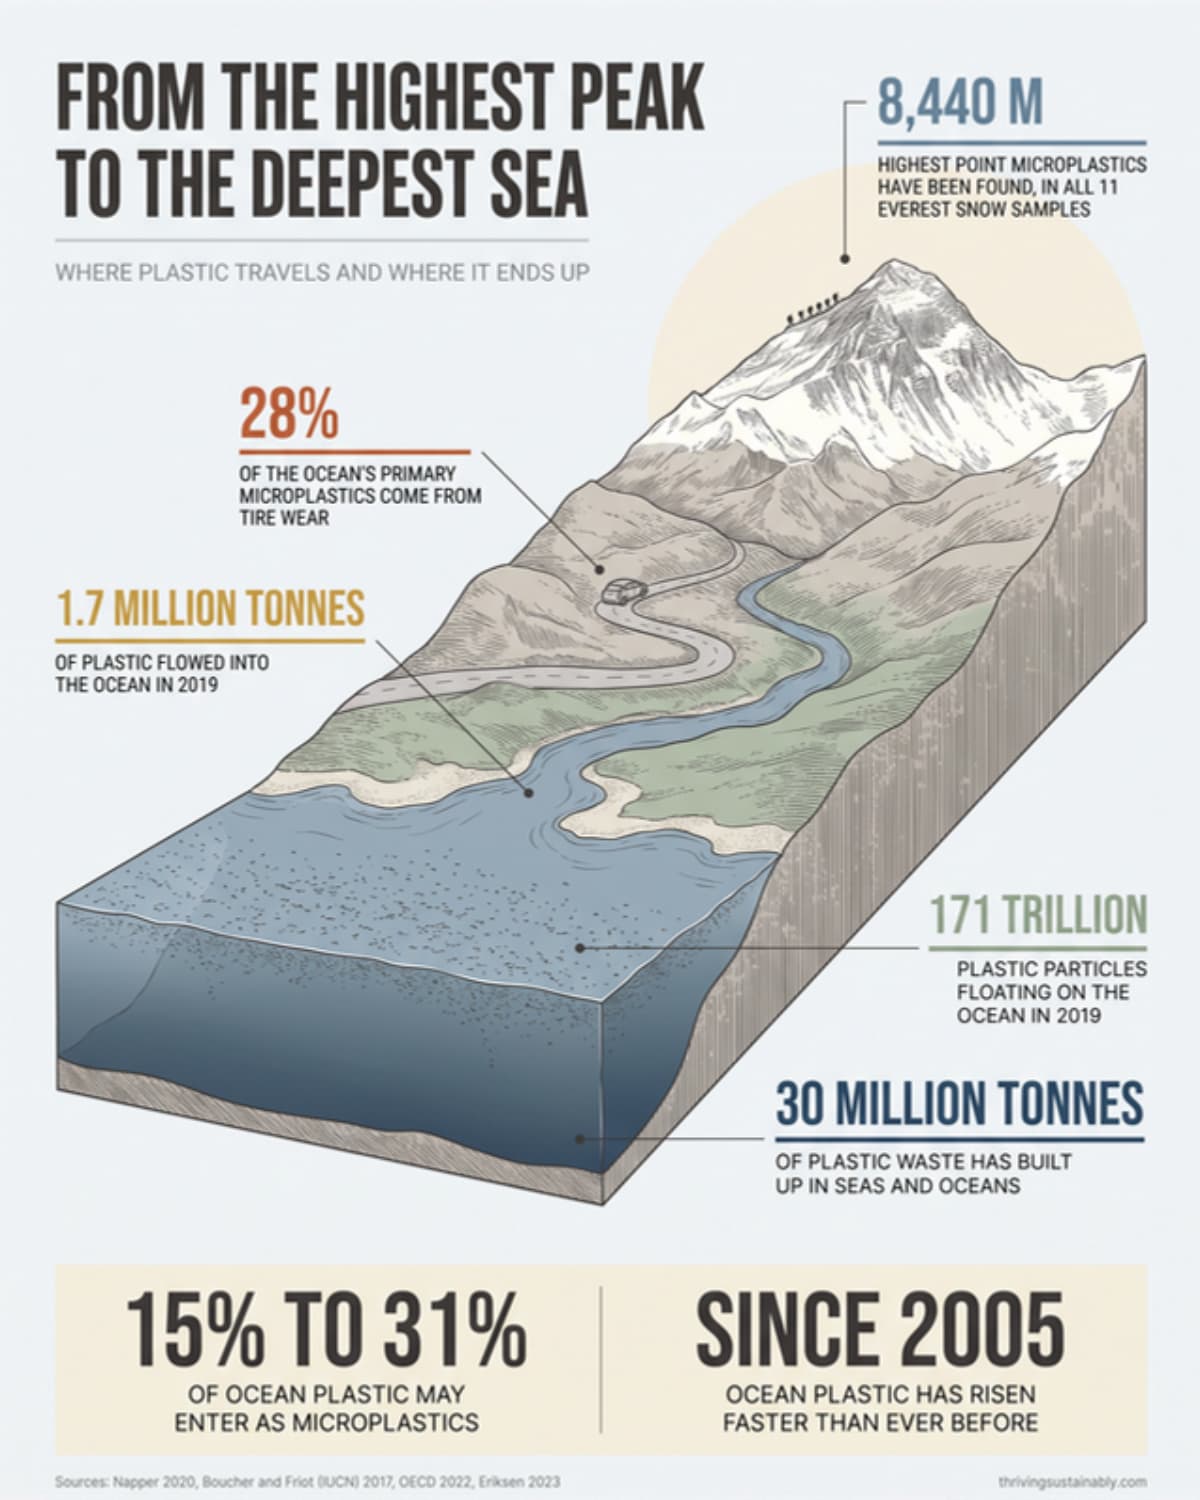
- Floating plastic: an estimated 82 to 358 trillion particles (about 171 trillion on average) were floating in the ocean in 2019, weighing about 2.3 million tonnes on average, within an estimated range of 1.1 to 4.9 million tonnes (Eriksen et al., 2023).
- Rapid rise: ocean plastic increased rapidly and without precedent after 2005 (Eriksen et al., 2023).
- Where it starts: 15 to 31% of the plastic released into the ocean each year may enter as primary microplastics, and almost two-thirds of that comes from washing synthetic clothes and tire wear (Boucher and Friot, 2017).
- Tires: tire wear is the second biggest source of primary microplastics in the ocean, at about 28% (Boucher and Friot, 2017).
- Everest: microplastics were found in all 11 snow samples taken on Mount Everest, as high as 8,440 meters, mostly polyester fibers (Napper et al., 2020).
- Ocean totals: about 1.7 million tonnes of plastic flowed into the ocean in 2019, and about 30 million tonnes has built up in seas and oceans, according to the OECD (2022).
Plastic does not stay in the water, either. It settles into farm fields and garden beds too, which we cover in our guide to microplastics in soil.
How Much Plastic Does the World Make and Recycle?
The world produced 430.9 million tonnes of plastic in 2024, and only about 9% of plastic waste is recycled.
Every microplastic starts as a larger piece of plastic, which is why production numbers matter. The amount we make keeps growing, while recycling has barely moved.
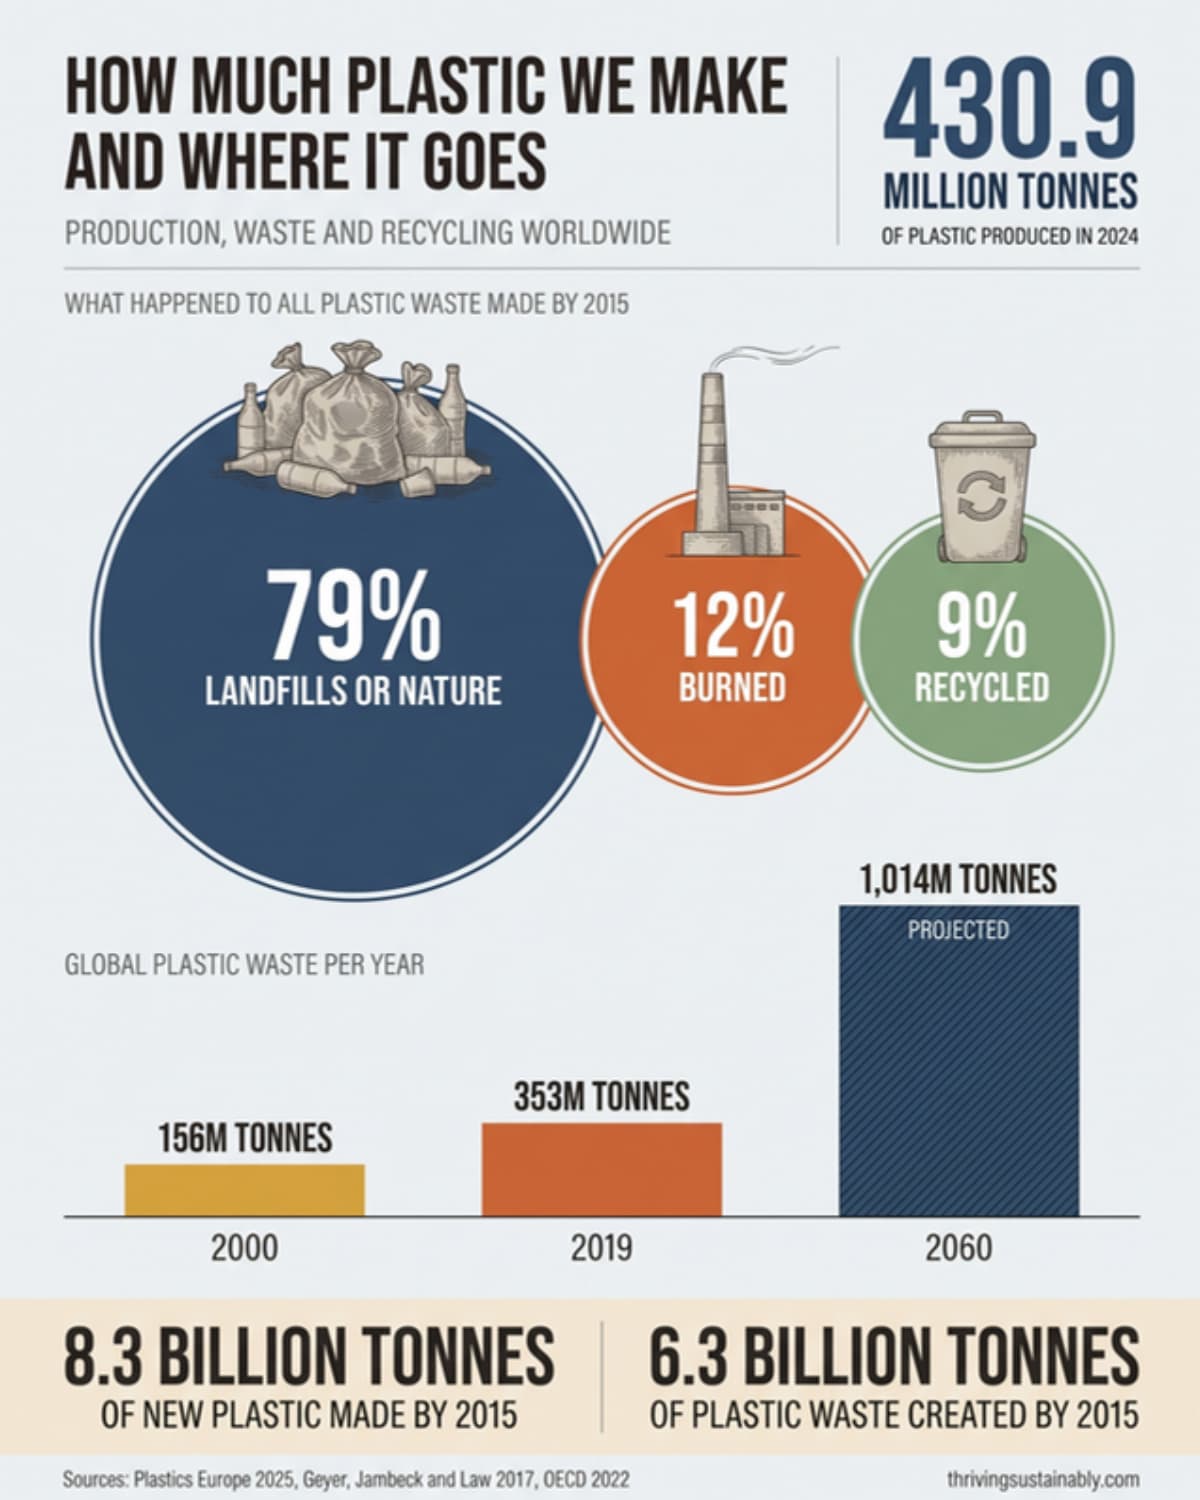
- Production: global plastics production reached 430.9 million tonnes in 2024, up 4.1% from 2023 and 16.3% since 2018 (Plastics Europe, 2025).
- All-time total: about 8,300 million tonnes of new plastic had been made by 2015 (Geyer et al., 2017).
- Where it went: of the 6,300 million tonnes of plastic waste created by 2015, about 9% was recycled, 12% was burned and 79% piled up in landfills or the environment (Geyer et al., 2017).
- Waste doubled: plastic waste more than doubled from 156 million tonnes in 2000 to 353 million tonnes in 2019 (OECD, 2022).
- Recycling today: only 9% of plastic waste is recycled, 19% is burned and almost half goes to landfill (OECD, 2022).
- The future: without new policies, plastic waste is projected to reach 1,014 million tonnes a year by 2060 (OECD Global Plastics Outlook, 2022).
- Climate: plastics are responsible for 3.4% of global greenhouse gas emissions (OECD, 2022).
Recycling helps, but at 9% it cannot keep up with how much plastic we make. Using less in the first place does far more, and our guide on how to recycle covers how to make the plastic you do use count.
Cite This Page
Thriving Sustainably. (2026). Microplastics Statistics From the Original Studies.
thrivingsustainably.com/microplastics-statistics
These statistics and graphics are free to use with a link back. Please also cite the original study listed with each stat.
What These Microplastics Statistics Mean for You
The biggest everyday sources in these studies, bottled water, plastic tea bags, plastic cutting boards and synthetic laundry, are also some of the easiest to swap.
These numbers can feel heavy, but several of the largest ones come from habits that are simple to change. Choosing tap water over bottled, loose-leaf tea over plastic tea bags, and a wood board over plastic each takes a big source out of your day.
If you only make one change, switch to a glass or stainless steel water bottle filled from the tap. Water is something you drink every day, so that one habit adds up faster than any other. When you are ready for the next step, our guide on how to remove microplastics covers filters and the rest of the home.
Save This Guide for Later 📌
Pin these microplastics statistics to your Pinterest board so you can find them the next time you need a number you can trust.
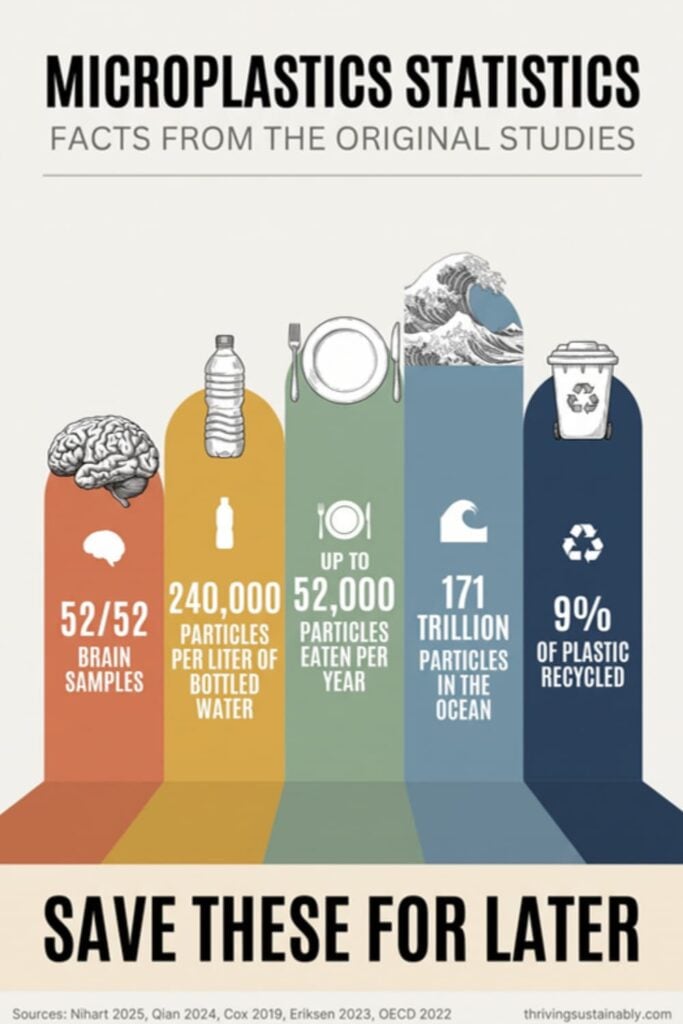
For a closer look at what scientists are learning about plastic and our health, this next guide picks up where these numbers leave off.
Don’t Miss: Microplastics Health EffectsWhat the research says so far about how microplastics may affect the heart, brain and hormones, and what is still unknown. Read more →The questions below come up most often when people read these numbers for the first time.
FAQs About Microplastics Statistics
A microplastic is any piece of plastic smaller than 5 millimeters, about the size of a pencil eraser or smaller. Pieces smaller than 1 micrometer are called nanoplastics, and they are small enough to move into cells.
Tap water is the better choice. One estimate found people who drink only bottled water may take in about 90,000 extra particles a year, compared with about 4,000 from tap water. A good filter on your tap lowers the count even more.
Scientists do not know yet. Studies have linked plastic in artery plaque to more heart attacks and strokes, and found higher plastic levels in the brains of people with dementia, but these studies show a connection, not proof of cause.
We review this page every quarter. When a new study replaces an older number, we update the figure and its source rather than leaving outdated data in place.
Final Thoughts About Microplastics Statistics
Microplastics are now in our water, our food, the air in our homes and our own bodies, and the amount keeps rising with every year of plastic production.
Behind every number on this page is a simple truth: the less plastic we make and use, the less ends up in us. The research is still young, and we will keep this page current as new studies come out. In the meantime, the swaps that cut the biggest sources are small, affordable and worth starting today.
📚 References
- Boucher, J., & Friot, D. (2017). Primary microplastics in the oceans: A global evaluation of sources. IUCN. https://doi.org/10.2305/IUCN.CH.2017.01.en
- Cox, K. D., Covernton, G. A., Davies, H. L., Dower, J. F., Juanes, F., & Dudas, S. E. (2019). Human consumption of microplastics. Environmental Science & Technology, 53(12), 7068-7074. https://doi.org/10.1021/acs.est.9b01517
- De Falco, F., Di Pace, E., Cocca, M., & Avella, M. (2019). The contribution of washing processes of synthetic clothes to microplastic pollution. Scientific Reports, 9, 6633. https://doi.org/10.1038/s41598-019-43023-x
- Eriksen, M., Cowger, W., Erdle, L. M., et al. (2023). A growing plastic smog, now estimated to be over 170 trillion plastic particles afloat in the world’s oceans: Urgent solutions required. PLOS ONE, 18(3), e0281596. https://doi.org/10.1371/journal.pone.0281596
- Geyer, R., Jambeck, J. R., & Law, K. L. (2017). Production, use, and fate of all plastics ever made. Science Advances, 3(7), e1700782. https://doi.org/10.1126/sciadv.1700782
- Hernandez, L. M., Xu, E. G., Larsson, H. C. E., Tahara, R., Maisuria, V. B., & Tufenkji, N. (2019). Plastic teabags release billions of microparticles and nanoparticles into tea. Environmental Science & Technology, 53(21), 12300-12310. https://doi.org/10.1021/acs.est.9b02540
- Hu, C. J., Garcia, M. A., Nihart, A., et al. (2024). Microplastic presence in dog and human testis and its potential association with sperm count and weights of testis and epididymis. Toxicological Sciences, 200(2), 235-240. https://doi.org/10.1093/toxsci/kfae060
- Jenner, L. C., Rotchell, J. M., Bennett, R. T., Cowen, M., Tentzeris, V., & Sadofsky, L. R. (2022). Detection of microplastics in human lung tissue using μFTIR spectroscopy. Science of the Total Environment, 831, 154907. https://doi.org/10.1016/j.scitotenv.2022.154907
- Kim, J.-S., Lee, H.-J., Kim, S.-K., & Kim, H.-J. (2018). Global pattern of microplastics (MPs) in commercial food-grade salts: Sea salt as an indicator of seawater MP pollution. Environmental Science & Technology, 52(21), 12819-12828. https://doi.org/10.1021/acs.est.8b04180
- Kosuth, M., Mason, S. A., & Wattenberg, E. V. (2018). Anthropogenic contamination of tap water, beer, and sea salt. PLOS ONE, 13(4), e0194970. https://doi.org/10.1371/journal.pone.0194970
- Leslie, H. A., van Velzen, M. J. M., Brandsma, S. H., Vethaak, A. D., Garcia-Vallejo, J. J., & Lamoree, M. H. (2022). Discovery and quantification of plastic particle pollution in human blood. Environment International, 163, 107199. https://doi.org/10.1016/j.envint.2022.107199
- Li, D., Shi, Y., Yang, L., et al. (2020). Microplastic release from the degradation of polypropylene feeding bottles during infant formula preparation. Nature Food, 1, 746-754. https://doi.org/10.1038/s43016-020-00171-y
- Marfella, R., Prattichizzo, F., Sardu, C., et al. (2024). Microplastics and nanoplastics in atheromas and cardiovascular events. New England Journal of Medicine, 390(10), 900-910. https://doi.org/10.1056/NEJMoa2309822
- Napper, I. E., Davies, B. F. R., Clifford, H., et al. (2020). Reaching new heights in plastic pollution: Preliminary findings of microplastics on Mount Everest. One Earth, 3(5), 621-630. https://doi.org/10.1016/j.oneear.2020.10.020
- Nihart, A. J., Garcia, M. A., El Hayek, E., et al. (2025). Bioaccumulation of microplastics in decedent human brains. Nature Medicine, 31, 1114-1119. https://doi.org/10.1038/s41591-024-03453-1
- NOAA National Ocean Service. (n.d.). What are microplastics? https://oceanservice.noaa.gov/facts/microplastics.html
- OECD. (2022a). Plastic pollution is growing relentlessly as waste management and recycling fall short, says OECD [Press release]. https://www.oecd.org/en/about/news/press-releases/2022/02/plastic-pollution-is-growing-relentlessly-as-waste-management-and-recycling-fall-short.html
- OECD. (2022b). Global plastics outlook: Policy scenarios to 2060. OECD Publishing. https://doi.org/10.1787/aa1edf33-en
- Plastics Europe. (2025). Plastics: The fast facts 2025. https://plasticseurope.org/knowledge-hub
- Qian, N., Gao, X., Lang, X., Deng, H., Bratu, T. M., Chen, Q., Stapleton, P., Yan, B., & Min, W. (2024). Rapid single-particle chemical imaging of nanoplastics by SRS microscopy. Proceedings of the National Academy of Sciences, 121(3), e2300582121. https://doi.org/10.1073/pnas.2300582121
- Ragusa, A., Svelato, A., Santacroce, C., et al. (2021). Plasticenta: First evidence of microplastics in human placenta. Environment International, 146, 106274. https://doi.org/10.1016/j.envint.2020.106274
- Ragusa, A., Notarstefano, V., Svelato, A., et al. (2022). Raman microspectroscopy detection and characterisation of microplastics in human breastmilk. Polymers, 14(13), 2700. https://doi.org/10.3390/polym14132700
- Textile Exchange. (2024). Materials market report 2024. https://textileexchange.org/
- Yadav, H., Khan, M. R. H., Quadir, M., et al. (2023). Cutting boards: An overlooked source of microplastics in human food? Environmental Science & Technology, 57(22), 8225-8235. https://doi.org/10.1021/acs.est.3c00924
- Yakovenko, N., Pérez-Serrano, L., Segur, T., Hagelskjaer, O., Margenat, H., Le Roux, G., & Sonke, J. E. (2025). Human exposure to PM10 microplastics in indoor air. PLOS ONE, 20(7), e0328011. https://doi.org/10.1371/journal.pone.0328011